I enjoy making things. Here are a selection of projects that I have worked on over the years.
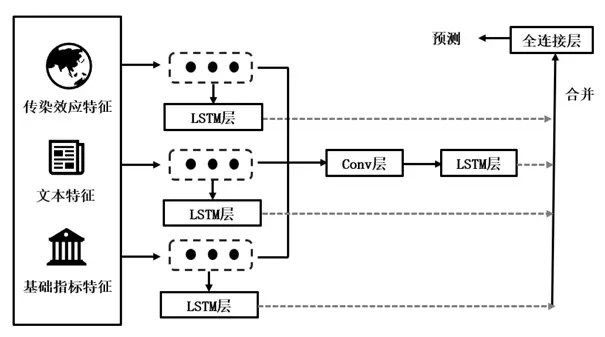
This project adopts multi-dimensional, heterogeneous data—covering contagion effects, textual information, and fundamentals—to construct a feature set. Contagion indicators are derived from global market indices, capturing inter-market risk structures and CoES-based correlation vectors. Text features come from A-share financial news, while fundamental indicators encompass macroeconomic, stock market, and foreign exchange data, plus historical systemic risk. A multi-branch LSTM model is then proposed to predict systemic risk in the A-share market. Three independent LSTM branches extract information from each modality, and a separate convolutional-LSTM branch learns holistic knowledge. Results show that contagion-network features significantly enhance model performance, and the multi-branch LSTM effectively supports the monitoring and early warning of systemic risk in the stock market.
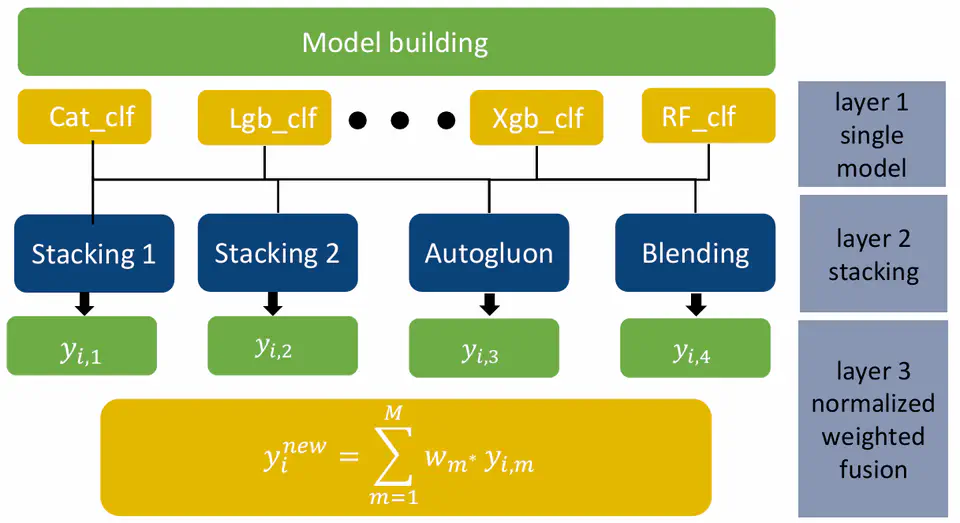
Competition: Third Sichuan University Financial Technology Modeling Competition Award: First Place **Awared by:**The Education Department of Sichuan Provincial This project, presented for the Third Sichuan University Financial Technology Modeling Competition, focuses on customer credit risk prediction and identification. It emphasizes constructing a stable, high-performing binary classification model for credit risk management based on financial data. Key Highlights Data Analysis and Preparation Data Overview: Combined datasets include 24,983 samples and 205 features. After preprocessing, 124 features remain (33 textual and ~33% date-related features). Data Cleaning: Missing values: Median imputation for continuous variables. Mode imputation for discrete variables. Filling with -99 for features with >95% missing. Encoding methods: Count encoding for categories with <10 values. WOE binning for categories with >10 values. Time features are extracted based on hours/minutes or intervals from the current day. Feature Selection and Engineering: Importance-ranked features selected via XGBoost. Featuretools used to generate new feature combinations. Model Building Architecture: Three-layered stacking framework: Layer 1: Base models include CatBoost, LightGBM, XGBoost, and Random Forest. Layer 2: Outputs from base models serve as inputs for four distinct sub-models. Layer 3: Final predictions are generated through normalized weighted voting. Model Optimization: 5-fold cross-validation and grid search are applied to optimize hyperparameters for base models. Evaluation Model performance is assessed using AUC (Area Under the Curve): Individual Models: CatBoost: 0.8486 LightGBM: 0.8476 XGBoost: 0.8464 Random Forest: 0.8423 Stacking and Voting: Stacking 1: 0.8523 Stacking 2: 0.8530 Voting: 0.8594 (Best Performance) Credit Rating System Structure: Customers are classified into 9 levels based on predicted risk, with clear distribution and distinguishable credit tiers. 9.77% of users belong to the top levels (8 and above), reflecting the model’s discriminatory power. Implementation: Integrated with a web-based system using Docker and Vue.js for front-end services. Compared to FICO models, the system provides zones for: Quality customers. Value exploration. Overestimation. Risk elimination. Conclusions and Suggestions The project demonstrates strong modeling capabilities through effective stacking and feature engineering. The authors suggest refining the model for real-world applications and exploring the scalability of the approach for diverse datasets. This project presents a robust credit risk modeling framework with promising performance, practical implications, and room for further enhancement in financial technology applications.
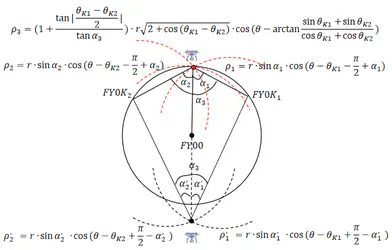
Competition: 2022CUMCM-B-Mathematics-Modelling Award: National Second Place **Awared by:**China Society for Industrial and Applied Mathematics This paper addresses the problem of passive localization and formation adjustment in UAV (Unmanned Aerial Vehicle) formation flying by developing models and innovative algorithms. The main contributions are summarized below: Problem 1, Subquestion 1: The task is transformed into finding the intersection points of multiple arc trajectories. A universal multi-point trajectory localization model is established in polar coordinates. An Information Source Traceback Algorithm (Appendix 2) is innovatively developed to match signal sources with UAV identifiers by comparing ideal and actual angles within an error margin. This allows solving corresponding trajectory equations and forming the final multi-point trajectory localization model (5.1.2) for UAV positioning. Problem 1, Subquestion 2: The problem is reformulated as an optimal incremental signal source planning task. A 0-1 optimization model (5.2.1) is created and solved using a looped search structure. The Information Source Traceback Algorithm is improved (Appendix 3) to account for slight UAV positional deviations. It identifies unknown UAVs by approximating their azimuthal angles. The solution reveals that adding only one UAV signal emitter achieves effective localization, excluding FY00 and FY01 (5.2.3). Problem 1, Subquestion 3: A greedy approach is used to construct an iterative optimization model for UAV positioning (5.3.1). Using fixed, unbiased signal sources (FY00 and FY01) as the coordinate system, other UAVs are iteratively selected for positioning and adjustment, reducing errors through convergence in three iterations (5.3.2). This results in an effective formation adjustment scheme. Problem 2: Based on the traceback algorithm and localization model, a conical formation adjustment scheme is developed (5.4.1). Localization starts with three UAVs forming a central equilateral triangle and expands outward layer by layer. The approach is generalized to any arbitrary formation (5.4.2), involving iterative adjustments using accurate UAV positions as references. Practical application is demonstrated with an example of adjusting UAVs in a “China”-shaped formation (5.4.3). Robustness Testing: The robustness of the improved traceback algorithm is verified through angle error discussions, ensuring reliability under slight positional deviations. Conclusion The paper emphasizes the Information Source Traceback Algorithm and Multi-Point Trajectory Localization Model as core methodologies. These are applied to real-world UAV localization and formation adjustment problems, offering optimized adjustment schemes and effective generalization to various scenarios.
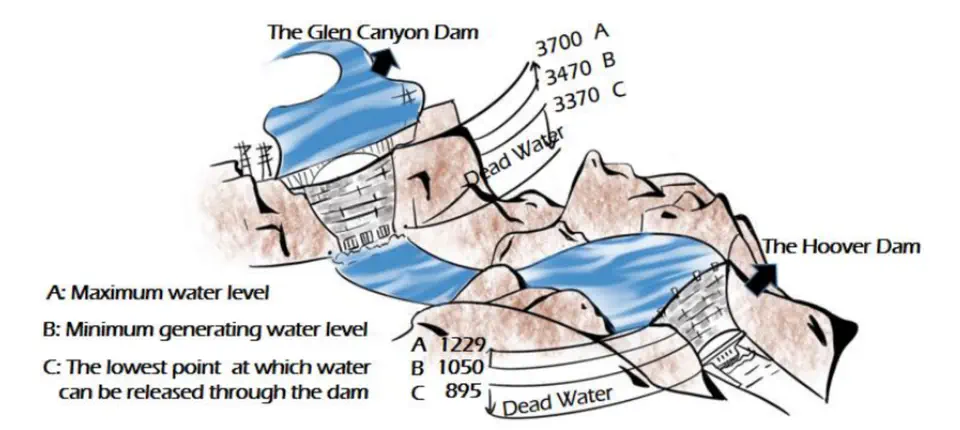
Competition: Mathematical Contest in Modelling Award: Finalist (Top: 2% among 27,205 Teams) Awarded by: the Consortium for Mathematics and Its Applications Water Loss in Dams Due to Climate Change: A Mathematical Approach Water loss in dams resulting from climate change has become a prominent problem in recent years, thus influencing humans’ life and production. To help address this issue, mathematical models are required to be established. Problem 1 Problem 1 can be divided into three parts: Service Area Coordination: Maps are rasterized, and service areas for two dams are classified using a Comparative Optimization Algorithm. Comprehensive Dispatching Model for Water: Demand Side: An AIR Model is established to capture water demands, resulting in: 11858569 m³ to be drawn from the Glen Canyon Dam. 40978282 m³ to be drawn from the Hoover Dam. Supply Side: Analysis of water levels and water volumes is conducted, with water-electricity generation fitted through Polynomial Interpolation, laying the foundation for subsequent analysis. Dynamic Programming Model: Calculates the time until demands are unmet at fixed water levels: For the highest water level, the time is 495 days. Additional water as a function of time is derived (see Section 4.6). To consider Mexico’s residual claims, a Water-Supply Corridor Model is proposed, balancing respect for rights and interests (see Section 4.7). Problem 2 A Multi-Interest Tradeoff Model is developed using Goal Programming and Input-Output Theory: Economic Benefits as Criteria: Four “players” of competing interests are identified. Results include: 11848077 m³ drawn from the Glen Canyon Dam. 39125274 m³ drawn from the Hoover Dam. Reallocation results in increased water for industry and decreased water for agriculture (see Section 5.2, Table 5). Problem 3 When supply cannot meet all water demand: Inspired by the NSGA-II Algorithm (a type of Genetic Algorithm), specific approaches are recommended: Reducing the scale of industries with low water-use efficiency and allocating more water to efficient industries. Promoting technological innovation in industries with low water-use efficiency to improve resource utilization. Conclusion To ensure robustness, sensitivity analysis is conducted, and a summary article containing findings and suggestions has been written for the Drought and Thirst Magazine.